Let’s create a Bar Plot in Python with the seaborn library. First, let’s install the library:
pip install seabornNext, let’s write our sample code:
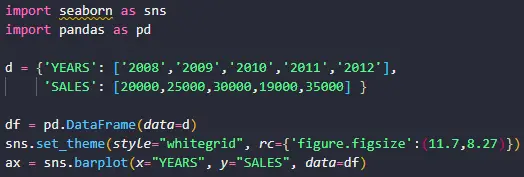
import seaborn as sns
import pandas as pd

d = {'YEARS': ['2008','2009','2010','2011','2012'], 'SALES': [20000,25000,30000,19000,35000] }

df = pd.DataFrame(data=d)
sns.set_theme(style="whitegrid", rc={'figure.figsize':(11.7,8.27)})
ax = sns.barplot(x="YEARS", y="SALES", data=df)

import matplotlib.pyplot as plt
plt.show()
Let’s explain what is going here:
- We import the seaborn and pandas libraries first.
- We define our data d and we create our dataframe df. This dataframe will have two columns: YEARS and SALES.
- sns.set_theme() allows us to set multiple theme parameters in one step. We are only setting the style parameter in this case which can be one of the following: darkgrid, whitegrid, dark, white, ticks. The method also accepts the rc parameter which overrides parameter mappings. In this case we are mapping the figure.figsize parameter from matplotlib which sets the width and height of the plot in inches.
- sns.barplot() shows the data in our dataset df as rectangular bars. Parameters x and y are our inputs. x represents the YEARS column and it will appear on the x-axis or horizontal axis of our bar plot. y represents the SALES column and it appears y-axis or vertical axis of our bar plot.
- Because seaborn is based on the matplotlib library we must import the same and use the plt.show() method to display our plot on the screen.
You can install matplotlib with the following command:
python -m pip install -U matplotlibFollowing is the output of our code:

Note that we got what we expected: a bar plot with YEARS on the x-axis and SALES on the y-axis. We can improve our plot by adding the data labels above each bar with the following code:
for p in ax.patches:
    ax.annotate(f"{p.get_height()}",
                   (p.get_x() + p.get_width() / 2., p.get_height()),
                   ha = 'center', va = 'center',
                   xytext = (0, 9),
                   textcoords = 'offset points')
The above code is simply adding our data labels neatly above each bar. A patch is a 2D figure with a face color and an edge color. In this case, a patch is a bar on our bar plot. p.height() gets the height of each bar (the same as SALES) and displays it on the top of the bar in the plot for easy visibility.✨✨ This gives us the following plot:

We hope our tutorial helped. Get the full source code HERE. And find out more about matplotlib HERE in another great tutorial.👌👌👌