
We will use python to plot vector graphs with matplotlib. Let’s go! ✨✨
A vector in math is a quantity that describes movement from one point to another. A vector quantity has both magnitude and direction. Graphically, a vector may be drawn as an arrow on a cartesian plane/2-dimensional plane. The magnitude will be the length of the arrow and the direction will be the direction to which the arrow head is pointed.
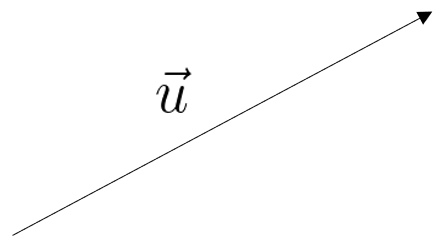
u is a graphical representation of a vector on a 2D plane. Many times, you will see a vector written as a column vector also. See below:
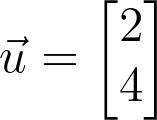
The top number shows us how many spaces to move on the x-axis and the bottom number shows us how many spaces to move on the y-axis.
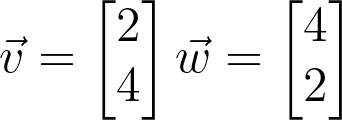
Let’s actually write the code to draw vectors on a 2D Cartesian Plan Graph Grid. We will draw two vectors v and w:
import numpy as np
import matplotlib.pyplot as plt

v = [2,4]
w = [4,2]

array = np.array([[0, 0, v[0], v[1]],
                 [0, 0, w[0], w[1]]])

X, Y, V, W = zip(*array)
plt.figure()
plt.ylabel('Y-axis')
plt.xlabel('X-axis')
ax = plt.gca()
ax.annotate(f'v({v[0]},{v[1]})', (v[0],v[1]),fontsize=14)
plt.scatter(v[0],v[1], s=10,c='red')
ax.annotate(f'w({w[0]},{w[1]})', (w[0],w[1]),fontsize=14)
plt.scatter(w[0], w[1], s=10,c='blue')
ax.quiver(X, Y, V, W, angles='xy', scale_units='xy',color=['r','b'],scale=1)
ax.set_xlim([0, 10])
ax.set_ylim([0, 10])

plt.grid()
plt.draw()
plt.show()
Let’s explain what’s going on here:
- First, import numpy and matplotlib.pyplot libraries. If you don’t have them installed run the following code in your terminal.
- pip install matplotlib
- pip install numpy
- We define our two 2D vectors v and w. These are simple arrays.
- We define a numpy array. This array has two elements which are also arrays with 4 members each; one for vector v and another for vector w. We have four members for each element of this numpy array because of the quiver() function which we will explain shortly.
- We call zip() on our numpy array to create 4 new arrays X,Y,V and W. X and Y define the arrow locations and V,W define the arrow directions. This will be needed for the quiver() method. Recall that zip converts a list of iterables into tuples.
- plt.figure() holds all the plot elements.
- plt.ylabel and plt.xlabel methods label the y and x axis.
- The plt.gca() method returns the current axes to ax.
- ax.annotate() method adds labels to the end of the vector line, near the arrowhead.
- plt.scatter() method adds a small color point or dot at the end of the vector line, exactly where the arrowhead ends.
- ax.quiver() method plots our 2D arrows. It accepts the previously defined X, Y, V and W along with a few other parameters. The angles=’xy’, scale_units=’xy’, scale=1 parameters together allow us to plot vectors on the x-y plane. The color[] parameter array allows us to customize the color of the vector lines.
- ax.set_xlim() and ax.set_ylim() set the x and y axis view limits. In this case 10 is the limit of the view on each axis.
- plt.grid() adds a grid of lines to the plot.
- plt.draw() and plt.show() allow us to show the plot on the screen.
When we execute the code we get the following:
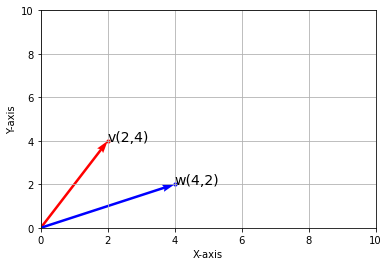
Thanks for reading. We hope this helped! Find the Python Notebook HERE. 👌👌👌