Let’s add and subtract vectors in Python! This is the first part of our Linear Algebra series. Let’s go! ✨✨
Recall that a vector in math is a quantity that describes movement from one point to another. A vector quantity has both magnitude and direction. Check out our previous tutorial on how to plot vectors on graphs in Python.
Let’s start with 2D vector addition. See the general formula below:

To add vector v and w we simply add the first component of each vector (v1 and w1) which gives us the first component of the sum (v1 + w1). Then we add the second component of each vector (v2 and w2) which gives us the second component of the sum (v2 + w2). Our result is a column vector with the same amount of rows and columns as each of the vectors that comprise the sum (a column vector with 2 rows and 1 column in this case).
It’s really that simple. Let’s write some code to add 2 2D vectors:
import numpy as np

v = np.array([2,3])
w = np.array([3,3])
vw = v+w
print(vw[:, np.newaxis])
#Example 1 Output
#[[5]
# [6]]

v = np.array([-2,-3])
w = np.array([3,3])
vw = v+w
print(vw[:, np.newaxis])
#Example 2 Output
#[[1]
# [0]]
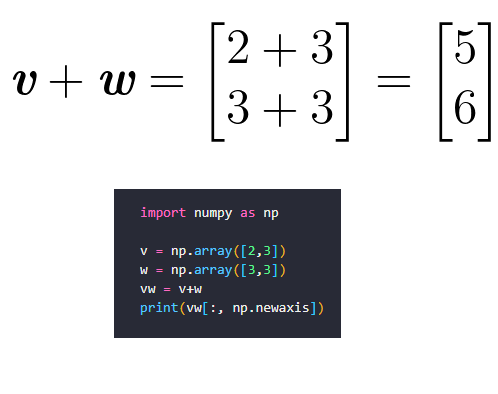
Above we give two examples using numpy arrays. Using numpy gives us the result that we expect in both cases. Example 1 is evaluated as follows:

Example 2 is evaluated as follows:

Generally speaking adding vectors abides by the commutative law which means:

Let’s do some 2D vector subtraction. The same principle applies but this time we are subtracting the first and second components which means (v1 – w1) and (v2 – w2) respectively. This gives us the two components of the result vector:

Note that vector subtraction is not commutative. Now let’s write some code:
import numpy as np

v = np.array([2,3])
w = np.array([3,3])
vw = v-w
print(vw[:, np.newaxis])
#Example 3 Output
#[[-1]
# [0]]

v = np.array([-2,-3])
w = np.array([3,3])
vw = v-w
print(vw[:, np.newaxis])
#Example 4 Output
#[[-5]
# [-6]]
Example 3 is evaluated as follows:

Example 4 is evaluated as follows:

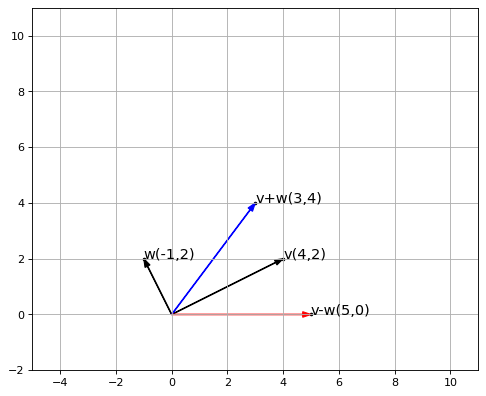
Now let’s do another example, but this time let’s plot our examples on a graph. First, let’s show how we evaluate the examples:
Here’s the code that will evaluate our vector arithmetic and plot them on a graph:
import numpy as np
import matplotlib.pyplot as plt
from matplotlib.pyplot import figure

def plot_vector2d(vector2d, s, origin=[0, 0], **options):
    plt.gca().annotate(f'{s}({vector2d[0]},{vector2d[1]})', (vector2d[0],vector2d[1]),fontsize=13)
    plt.scatter(vector2d[0],vector2d[1], s=5,c='black')
    return plt.arrow(origin[0], origin[1], vector2d[0], vector2d[1],
          head_width=0.2, head_length=0.3, length_includes_head=True,
          width=0.02,
          **options)

figure(figsize=(8, 6), dpi=80)
v = np.array([4,2])
w = np.array([-1,2])
vw = v+w
plot_vector2d(v,'v', color='black')  #v
plot_vector2d(w,'w', color='black')  #w
plot_vector2d(vw, 'v+w', color='b')  #v+w

vw = v-w
plot_vector2d(vw, 'v-w', color='r')  #v-w

plt.axis([-5, 11, -2, 11])
plt.grid()
plt.gca().set_aspect("equal")

plt.show()
Let’s explain what’s going on here:
- We import the numpy and matplotlib libraries which we will use.
- We define a function plot_vector2d which accepts a numpy vector (and a few other parameters) and adds them to a vector plot. The plot shows each vector as an arrow that starts at the origin and terminates at the vector point (represented by a small dot at the end of each arrowhead) on the Cartesian plane. Each vector point is also labelled for readability.
- We define vectors v and w. We plot the vectors individually, the sum of the vectors (v+w) and the difference of the vectors (v-w) on the same plot.
- We set the scale of the x-axis and y-axis.
- We show the plot to the user on a square grid graph.
The above code will give us the following plot:

So we know how to add and subtract vectors in Python and also plot them on a cartesian plane. Next we will be doing vector multiplication. Find the Python Notebook for this tutorial HERE. Find the full code HERE.
Thanks for reading!👌👌👌

