Be sure to check out PART 1 of our tutorial before you proceed. Next you will load Sample Data into a SQL instance:
Load Sample Data into SQL Server 2022 instance
The sample data used will be the US National Parks Visitors Data from data.world.
A Github repo was prepared with a SQL script to load a subset of this data into a new SQL database called `RetoolSampleDataDB`.
Create a new SSH session into the Ubuntu VM, and do a `git clone` of the repo. Fortunately the git tool should already be installed on the VM. Navigate to the new `RetoolMSSQLDBSetup` folder when the clone completes and you will see a single file called `setup.sql` which is a SQL script that creates the database objects and loads the data.
Copy the file from this location into the running container with the following command at the terminal:
sudo docker cp setup.sql container_name:/setup.sqlReplace the `container_name` with the actual name of your container.
Next, open a new shell into the running container with the following command. You will need to do this so you can run the script you just copied:
sudo docker exec -it -w / container_name "bash"This command will open a new `bash` shell in the running SQL 2022 container at the root folder location `/`. Remember to change the `container_name` to the actual one you created.
When executed the prompt will change to look like the following, which indicates the shell was successfully created:
mssql@container_name:/$Do a directory listing with the command `ls -al` to ensure that the `setup.sql` file did indeed copy successfully. If it did, you should see it by name.
Finally you will execute the `setup.sql` script using the sqlcmd utility in the container with the following command:
/opt/mssql-tools/bin/sqlcmd -S localhost -U SA -P 'XXXXXXX' -i setup.sqlThe identifier `localhost` refers to the default SQL instance. Substitute the `XXXXXXXX` for the actual SA password. If all goes well the script should execute and you should see messages that indicate that database rows are being created. When the execution completes you should be returned to the container terminal prompt. Exit this command prompt with the `exit` command to return to the Ubuntu VM default prompt.
Refresh the database connection in the SSMS tool to see the new database created. Navigating into the new database you will see one new table `NationalParkList`.
Now that you have loaded the data, you will now begin creating your Admin Panel in Retool.
Build out Retool Admin Panel
Navigate back to Retool using the Team URL you generated earlier at sign up. It should look something like `https://XXXXXXX.retool.com/`.
On the landing page, look for the Resources tab at the top on the left next to the Apps tab. This should take you to a new page titled Resources. Locate the big blue Create new button, click it, then select the Resource option.
A new page called Connect a resource will come up. Under the Select a resource type you will select Microsoft SQL. This will take you to a page with a form called Configure Microsoft SQL where you will set up the connection between your SQL instance and Retool:

Enter any Name you find suitable. The Host will be the external IP of the Ubuntu VM, Port is 1433, Database name is RetoolSampleDataDB, Database username is sa and the Database password is the SA password you created before.
If all goes well, when you click the Test Connection button you will see a Connection Success message and you can then click the blue Create resource button.
If the resource creation was successful a Resource created message prompt will be shown and you will be given the option to create an app that references the database resource you just created. Click the blue Create an app button.
At the next prompt that is shown, enter the National Park Visitors Admin Panel for the App name and then click the Create app button to create the app. You will then be taken to the Retool App Editor to build your Admin Panel.
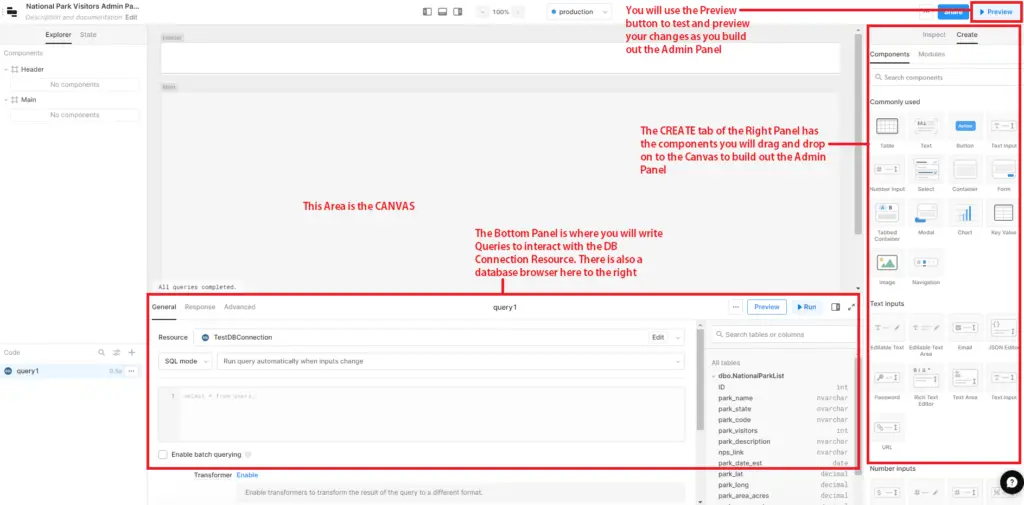
It is strongly recommended that you browse the Retool App Editor docs for a full explanation of the App Editor interface and its various sub-sections. This tool will be heavily used in the upcoming sections. The right hand panel with its Component, Create and Inspect are very important to what you will build.
Add Title, Table to View Rows and Statistics
The first thing you will do is add a title to the admin panel. Look for the Text component on the Right Panel and drag it onto the Header section of the canvas. When you do this the component changes to Inspect mode and you can give the component a name and change its value. Standard Markdown syntax can be used here for the component value so use the following for the Title:
# 🌲National Park Visitors Admin Panel🌲Try to get the text component as centered as possible using the Layout Alignment option and use the handles to adjust the size.
Next you will add a new query in the bottom panel to show all the rows in the dataset. There should be one there already, rename it to `listAllRows`, ensure that SQL mode is selected and type the following query in the text area:
select * from NationalParkListThis is a basic select query against the `NationalParkList` table.
Now drag the Table component from the right panel on to the canvas. The default name will be table1. The component should automatically use the `listAllRows` query you just defined as its source data. If not, enter the following code in the _Data_ field of the component’s inspect mode:
{
  {
    listAllRows.data;
  }
}
You should recognize the above as JavaScript. In Retool, anything inside the `{{ }}` construct is JavaScript. See the official Retool JavaScript docs for more.
You will now add three statistics components that will provide a sum of the `park_visitors`, `park_area_acres` and `park_area_sq_km` columns as figures at the top of the admin panel.
Drag three statistics components from the right panel onto the canvas. You can scroll down to find them or simply search for them by name in the search bar of the right panel.
The label of the first statistic component is Total Annual Visitors for All Parks and the Primary value will be the following JavaScript code:
{
  {
    table1.data.park_visitors.reduce((x, y) => x + y, 0);
  }
}
The `reduce()` JavaScript function will return the sum of all the elements of an array, which is exactly the desired sum in this case.
_table1_ is the table component you created earlier and `park_vistors` is the column of the table that will be summarized via addition to provide the value displayed.
Similarly, the other two statistic components both labelled Total Area of Parks, the Primary value to calculate the total sum in Acres will be:
{
  {
    table1.data.park_area_acres.reduce((x, y) => x + y, 0);
  }
}
The above summarizes the `park_area_acres` column of the table component.
And the total sum in Square Kilometers will have the Primary value:
{
  {
    table1.data.park_area_sq_km.reduce((x, y) => x + y, 0);
  }
}
The above summarizes the `park_area_sq_km` column of the table component.
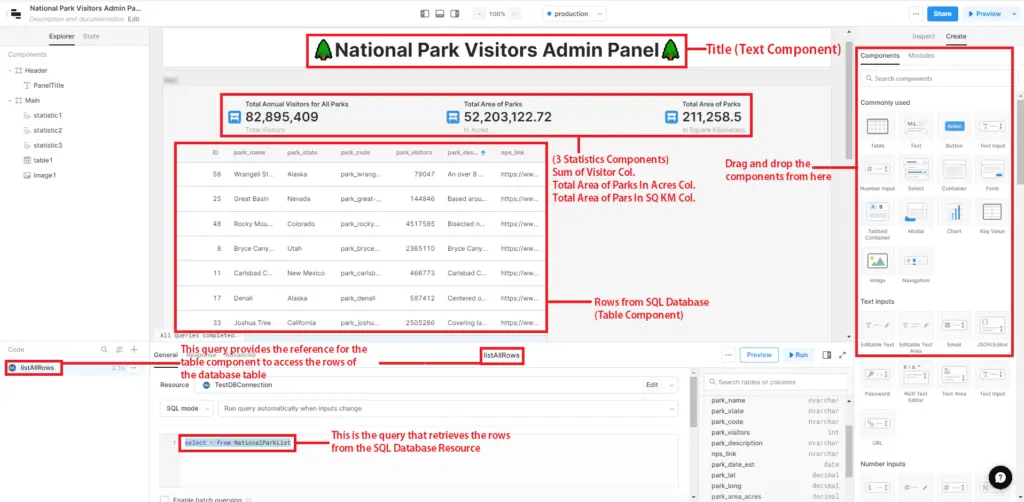
If all went well, you will see a title, three statistics components and a table component showing rows of data from the SQL database:
Add a Form to Add New Records
Next you will drag a form component from the right panel onto the canvas.
In the middle of this new form component you will see a link generate form from data. Click it and a new Form Generator window will come up. Select the SQL database resource you created before from the Source pick list and the data source column list will be returned:
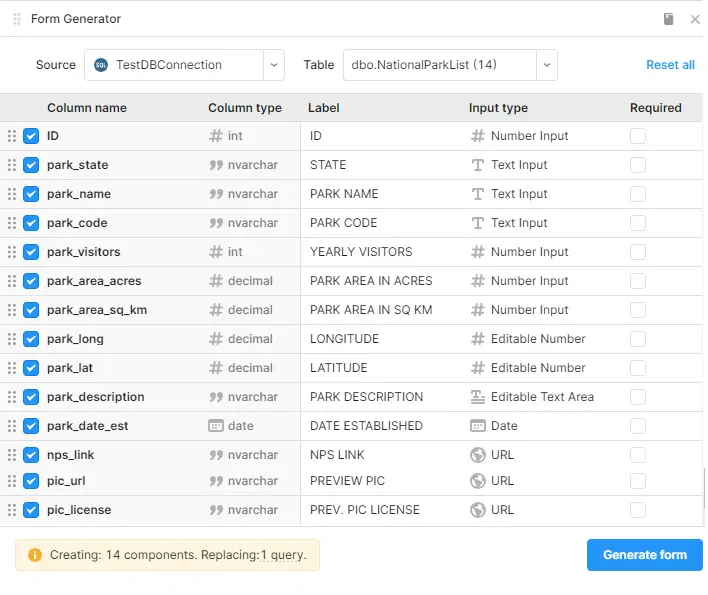
Before you click the blue Generate form button, make sure your rows are ordered, labelled and that the input type is the same as above. When you are sure all is well, click Generate form to continue.
Now you will make several changes to the form component to enable it to add new records. Change the form title to the following value:
#### Create, Update or Delete RowsEventually this form will be able to accomplish all three, but for now you are configuring the form to do insertion of new rows only.
Change the value of the ID field on the form to the following Javascript code:
This will enable a default value for the ID field which will increment automatically by 1 to ensure that it is unique for every new row inserted.
Next you will change the Default value and the Format of the DATE ESTABLISHED form field to 2/2/1919 and M/d/yyyy respectively.
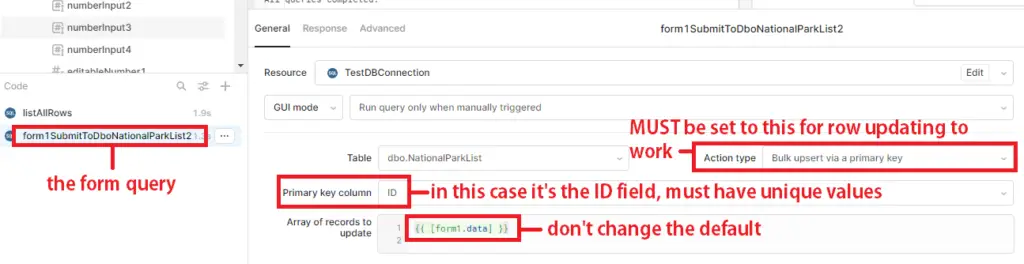
Next you will edit the form query to ensure that it works for insertions. On the lower left panel, there is a Code section where a new query will appear below the one you already created. It should be called `form1SubmitToDboNationalParkList` by default or similar (the one in the screenshot is called `form1SubmitToDboNationalParkList2`). It was automatically created when you created the form. Make sure that it appears as follows, with all the same values selected:
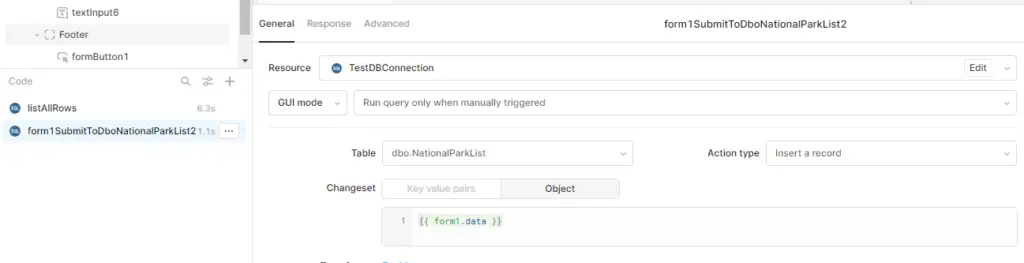
The GUI Mode, Table, Action type and Changeset should be set exactly as above:
The Changeset text is as follows for your reference:
{
  {
    form1.data;
  }
}
Next click on the Submit button on the form and change to inspect mode. Under the Event handlers of form1, click the box and ensure the values are the same as below:
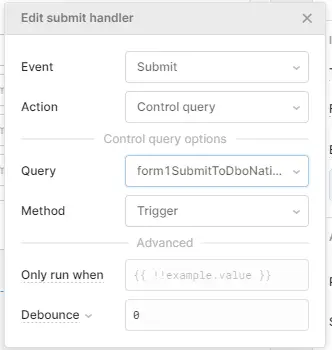
The Query must be set to the same query that was created when you created the form.
If all goes well, when you switch to preview mode by clicking the Preview button on the upper right hand side you should see the following:
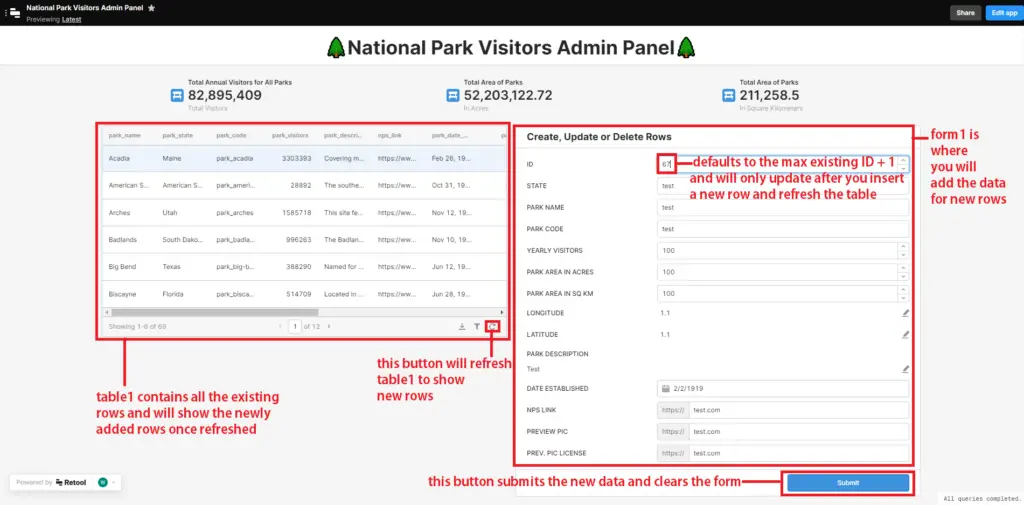
When you add new data in the form fields and click Submit the new data should be added to the table in your SQL database and a short message Query ran successfully message should flash at the top of the Panel. Be sure to refresh the table using the refresh button on the lower right hand side to see the newly added rows and also to update the default ID value.
Click the Edit app button on the upper right hand side where the Preview button was to return to the Editor.
Update and Delete Records
Next you will update the Initial data value of the form you just created, form1. Click the form, enter inspector mode and update this value to the following JavaScript code:
{
  {
    table1.selectedRow.data;
  }
}
This will allow the form to show the field values of any selected row in the table you created, _table1_.
Then click table1, go to inspect mode and look for the Allow clear selection from the toolbar. Toggle this from off to on.
When you enter Preview mode to test this you will find that the form values change depending on what row is selected. You can transition from this back to adding new rows by clicking the new link at the bottom of table1 labelled Clear selection.
You will now change the form query settings to allow updating of existing rows.
Change the settings to what is pictured above for the `form1SubmitToDboNationalParkList` (or similar) query.
This simple change will allow you to update existing rows in addition to adding new rows. When you go into _Preview_ mode you should be able to make changes to existing rows by clicking them in the table, editing the values in the form and then clicking _Submit_. If the query was successful, when you refresh you should see the updated value in both the form and the table. Neat right?
Now you will create a new query to delete a row. On the left hand panel in the Code section, click the `+` sign to open up a mini-menu and select Resource query. Name it whatever your wish but in this article it will be called `deleteSingleRow`. Ensure the settings are as follows:
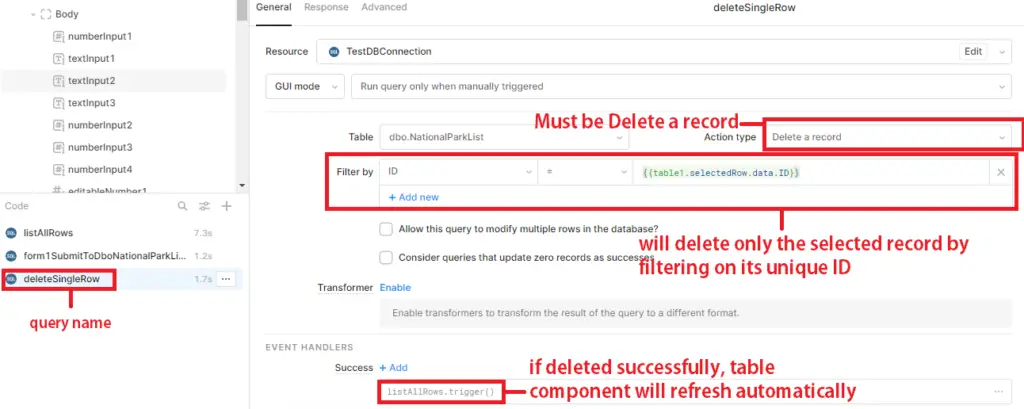
The expression filters on the `ID` of the row to ensure that only that unique record is deleted:
{
  {
    table1.selectedRow.data.ID;
  }
}
Now add a button that references the delete query. Drag and drop a button component from the right panel name it `Delete This` and edit the click handler in the inspector to look like the following:
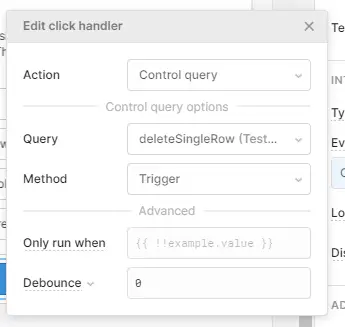
Ensure that the Query field is set to the name of the delete query you just built. When this is done, go into Preview Mode to test the changes. You should be able to Add, Edit and Delete rows at this point. Awesome!
Final Touches
Three further optimizations you can now add to your Admin Panel are to allow the picture preview in the `pic_url` database field to be shown, to allow map information to be shown and to automatically refresh the table after a new record is added or updated.
Drag an image component from the right panel to the space directly under the table component to the left of the admin panel. In inspect mode, change the Image source value to the following:
{
  {
    table1.selectedRow.data.pic_url;
  }
}
In _Preview_ mode this will allow this control to show the image at the URL specified in the `pic_url` database table column. It will change depending on the row selected also.
Next drag a Mapbox component on to the canvas. By default it is called mapboxMap1. Position it just below the image component. In the inspector mode, change the value for the map Latitude to the following:
{
  {
    table1.selectedRow.data.park_lat;
  }
}
And the value for the map Longitude will be:
{
  {
    table1.selectedRow.data.park_long;
  }
}
Change the Zoom value to 2 and change the Points value to the following:
{
  {
    [
      {
        longitude: table1.selectedRow.data.park_long,
        latitude: table1.selectedRow.data.park_lat,
      },
    ];
  }
}
And now change the _Marker_ to something suitable. The ❌ symbol was used in this example.
Switching to _Preview_ mode, you will now see an actual world map zoomed in and marked by the ❌ symbol on the location of the `park_lat` and `park_long`. When you change the selection on the table component, the map should also change to show that new location. Impressive!
Finally, change the Success event handler for the form query (`form1SubmitToDboNationalParkList` or similar) to be the same as for the _Delete This_ button you just created. Select the query in the lower left panel and change the value for _Query_ in the bottom panel Success event handler to the following:
listAllRows.trigger();Also change the text of the button from Submit to Add or Edit Row.
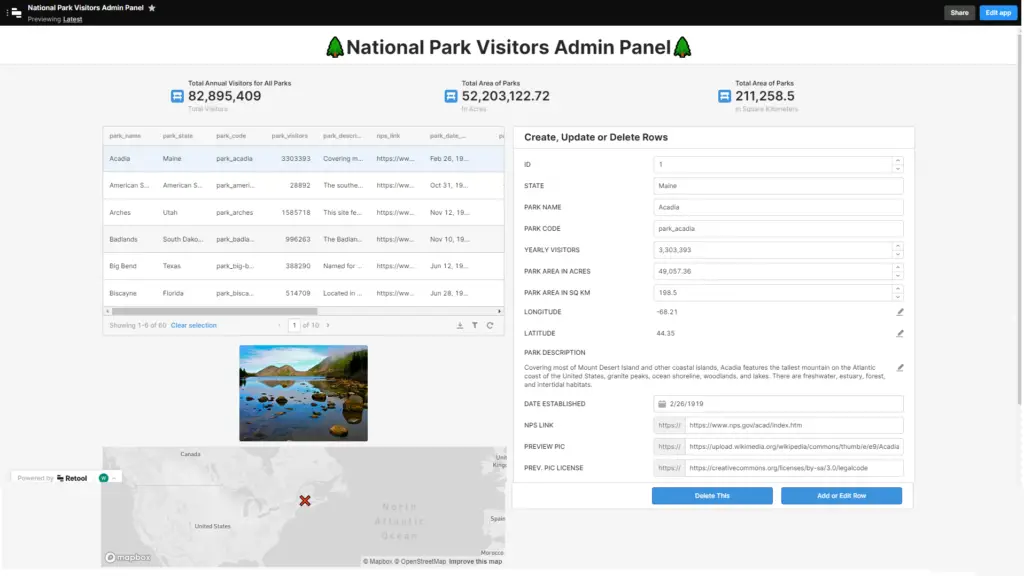
Now that the Admin Panel is fully built out, it should look like the following:
Wrapping Up
What a journey! You learned:
– How to set up an Ubuntu VM on the Google Cloud Platform and configure for remote access
– How to provision an instance of SQL Server 2022 Preview as a Docker container on an Ubuntu VM
– How to load sample data into a Docker container instance of SQL Server 2022 Preview
– How to create an account on the Retool platform and create a Microsoft SQL database source for an Admin Panel app.
– Rapidly build out an Admin Panel in Retool that displays summary statistics and allows browsing, editing and deletion of rows in a SQL database by using Retool UI components and JavaScript code.
Consult the official Retool online documentation for further details on any aspect of the Retool platform.
The app that you built was done on the online Retool platform but Retool also offers a self-hosted solution to allow implementation on your own infrastructure if you desire.
Also check out the ready-made templates that can get you up and running quickly.
Moreover, if you are looking for an easy to use, drag-and-drop platform with rich UI components for rapid development of custom internal tools, please consider Retool. Happy coding and thanks for reading.